
- North Pacific LCC CPA |
- Use Cases |
- Integrated Scenarios Case Study #2
Integrated Scenarios Case Study #2
Integrated Scenarios Case Study: Scenario Analysis
The following is a case study for the use of future climate projections from the Integrated Scenarios project, which illustrates an example of a 'scenario analysis' and an example where it was necessary to perform an additional bias correction processing of the downscaled climate data.
Case Study
Application: Future Streamflow and Water Quality in Sprague River Watershed
Climate Interests: The Sprague River in Oregon (Western USA) is an important source of upstream water quality for humans in the Klamath Valley and water source for wetlands in the Klamath Basin. The researchers wanted to investigate the future projections of streamflow, in-stream sediment/nutrient loads and water supply for the sustainability of the wetland ecosystem and the protection of human health.
Geography: The Sprague River watershed is a snow-dominated watershed. It is a region of complex topography and micro-climates.
People Involved: This study was a Masters project for Rosemary Records, a watershed science graduate student in Geosciences at Colorado State University in Fort Collins. Her advisor, Dr. Mazdak Arabi, a professor in the Civil and Environmental Engineering department, does research focused on management of water resources at the watershed scale.
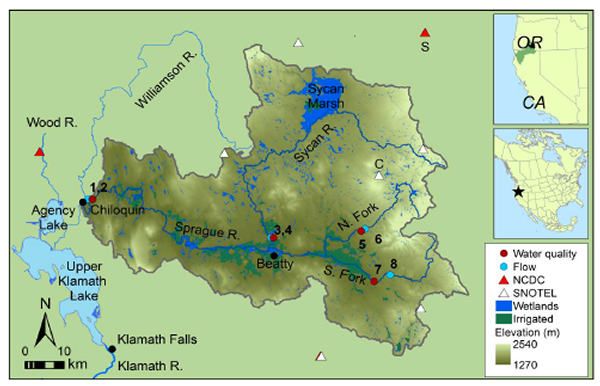
Methods: The researchers planned to use future climate data as inputs to the Soil and Water Assessment Tool (SWAT) hydrologic model to model the water quality under 'no future land use change' and under 4 scenarios of wetland loss. The SWAT hydrologic model was calibrated for the Sprague River watershed based on long term climate data from 6 SNOTEL and 2 NCDC station locations (see 1-8 on map of watershed). The SWAT simulation requires daily weather data for average temperature and precipitation at each of the 8 locations.
Climate Data
Data Product: The researchers chose the MACA statistically downscaled CMIP5 projections for their study. This method has a joint bias correction of temperature and precipitation, which is ideal for mitigating biases in snowfall in regions of complex topography.
Variables: The researchers used the MACA downscaled variable of precipitation and used the average of the downscaled variables of min/max daily temperature as a proxy for mean temperature.
Time Period: The researchers was interested in the mid-21st century so chose a 30-year period of 2030-2059 to look at future climate projections. They chose the full historical years of 1950-2005 from the downscaled GCM data.
Global Climate Models and Scenarios: The researchers was interested in selecting a few models that represent extreme or average future projections to access potential vulnerability of the watershed.
Utilizing the scatterplot tool from the Integrated Scenarios website (with 2040-2069 as the future time period), we can see the spread of projected changes in mean annual temperature (x-axis) and annual precipitation (y-axis) across the 20 downscaled GCMs for the two different scenarios averaged over the Sprague River Watershed: 42.0211 - 43.1878 N latitude, 121.2-122.0 W longitude.

From this scatter plot, the researchers identified three models for their scenario study:
-
a "warmer-drier” model: RCP8.5 inmcm4
-
a "warmer-wetter” model: RCP8.5 CanESM2
-
an "average" model near the center of the ensemble distribution: RCP8.5 MIROC5
Downloading the Data
Utilizing the Design-Your-Own-CSV tool from the Integrated Scenarios website, the researchers can download the downscaled climate data as Comma Separated Value (CSV) text files. The researchers would here select 1) daily (climate and hydrology models), 2) the historical (1950-2005) and then the RCP 8.5 (2005-2099) scenario, 3) the latitude/longitude of their 8 point locations, 4) nine variables (3 variables times 3 models) for the columns, 5) MACAv2-LIVNEH for each column with 3 columns for each of inmcm4, MIROC5 and CanESM2 and variables precipitation, minimum and maximum temperature under each model. Clicking the 'Show CSV' button will show the data on the screen, while 'Download CSV' will download directly to your computer. The CSV file can be opened directly in Microsoft Excel.

Additional Data Processing
Since the researchers needed climate data very specific to the 8 locations in the watershed, it was important to perform a bias correction of the 4-km gridded MACA climate data to the climate data from the 8 weather stations. This processing was performed by K. Hegewisch using the same quantile mapping method utilized for MACA.
Analysis Methods
For each of the 3 models(inmcm4,CanESM2,MIROC5), the researchers ran the SWAT hydrologic model forced by the climate time series from the model's historical scenario for 1950-2005 and then the future RCP 8.5 scenario for 2030-2059 for each of 4 wetland loss scenarios.
The projected changes in some different hydrologic variables (including annual runoff, monthly streamflow, and sediment/nutrient loads) was calculated using each model's 2040s average (over 2030-2059) and each model's historical average (over 1950-2005).
References
Records, R. M., M. Arabi, S. R. Fassnacht, W. G. Duffy, M. Ahmadi, and K. C. Hegewisch (2014), "Climate change and wetland loss impacts on a western river's water quality ", Hydrol. Earth Syst. Sci., 18, 4509-4527, doi:10.5194/hess-18-4509-2014. (PDF)
Sprague River watershed figure is from Records et al, 2014.
- Citation
- Katherine Hegewisch. 2016. Integrated Scenarios Case Study #2. In: Data Basin. [First published in Data Basin on Apr 27, 2016; Last Modified on Jun 14, 2016; Retrieved on Jul 15, 2025] <https://databasin.org/articles/86a66b95103849a19b5aee7e575b3ed1/>
About the Author
Katherine is a postdoctoral fellow working under Dr John Abatzoglou, a climatologist in the Department of Geography at the University of Idaho. Katherine's background is in computation and statistics. Katherine has been working on the statistical downscaling of global climate model(GCM) outputs...